

In preparation for tomorrow’s PAAD, I am reposting this PAAD from August 21, 2024
In 2024, I don’t think any one of you would contemplate providing a vapor anesthetic without using end-tidal gas analysis. Alveolar end-tidal gas concentration serves as a biomarker for sevoflurane effect site concentrations in the brain. Thus, using well-established MAC values, the end-tidal vapor concentration can be titrated to some perceived level/depth of anesthesia. But what about propofol? Unlike sevoflurane, there is no practical way to measure in real time blood or effect site concentrations of propofol. Without this knowledge we can only guess what dose of propofol to give to our patients which can result in under- or over-dosing. Thus, in the United States, when using propofol for TIVA, we essentially fly blind, just like we did with vapor anesthetics before gas analysis became widely available.
On the other hand, in 90% of the world, propofol is administered by target-controlled infusion (TCI) pumps, which estimate target propofol effector site (brain) concentrations based on population pharmacokinetics. However, even when using TCI, the effector site target is based on population and not individual concentrations. Thus, for some people the administered infusion dose may be too high or too low. And how much to give infants and young children is really problematic due to biological variations in pharmacokinetics and pharmacodynamics related to age, as well as differences in body water/fat composition, kidney and liver function, and brain maturity. Thus, TCI is better than what we do in the U.S. but its hardly perfect. What if we could titrate propofol (and sevoflurane) on INDIVIDUAL effector site concentrations? That would be a real game changer! And that is now possible with EEG monitoring. Indeed, it doesn’t take a genius to imagine a near future, when EEG and spectral edge frequency 95 (SEF95) will be as ubiquitous as pulse oximetry in every operating room.
Science fiction? Absolutely not! In today’s PAAD, Yuan et al.1 describe the use of EEG and SEF95 to assess the depth of propofol sedation and general anesthesia in infants between 3-12 months of age. This combined with their previous work in older children2-5 sets the stage for a revolution in how we administer anesthesia. Because this is hardly my area of expertise, I’ve asked Dr. Jerry Chao and one of the authors of today’s PAAD, Dr. Ian Yuan to assist. Myron Yaster MD
Original article
Yuan I, Garcia-Marcinkiewicz AG, Zhang B, Ulrich AM, Georgostathi G, Missett RM, Lang SS, Bruton JL, Kurth CD. Electroencephalographic Indices for Clinical Endpoints during Propofol Anesthesia in Infants: An Early-phase Propofol Biomarker-finding Study. Anesthesiology. 2024 Aug 1;141(2):353-364. doi: 10.1097/ALN.0000000000005043. PMID: 38718376.
Before we begin, a very, very brief review. “Intraoperative EEG monitors typically combine 4 to 8 electrodes into a disposable sensor placed on the forehead. Intraoperative EEG monitors approved for pediatric use include BIS (Medtronic, Minnesota, Minnesota), Narcotrend (MonitorTechnik, Bad Bramstedt, Germany), and SedLine (Masimo, Irvine, California). EEG waveforms are described using amplitude (how much the wave moves up and down) and frequency (how fast the wave moves up and down). Slow (<1hz) and delta waves (1-4hz) with large amplitudes are seen in deep sleep or coma, whereas theta waves (4-7hz) are present in light sleep. Alpha waves (8-12hz) are seen in an awake state with eyes closed or when meditating, whereas faster beta waves (13-30hz) are present in a state of active thinking.”4 During the administration of GABA-ergic anesthetics, waveforms consist of initial delta frequency activity during sevoflurane induction5 followed by the appearance of alpha frequency oscillations during clinical steady state conditions of general anesthesia with sevoflurane or propofol.6 How can you distinguish these different waveforms and their frequencies? Actually by color.
“The decomposition of an EEG waveform into discrete frequency bands (e.g. slow, delta, theta, alpha, beta, and gamma) over time allows creation of a spectrogram also known as a density spectral array (DSA), a type of processed non-proprietary EEG parameter. The DSA displays the relationship between EEG power and frequency over time. In the DSA, the x-axis represents time and y-axis represents frequency. To display EEG amplitude/power at a certain frequency and time, a colored or grey scale is used to represent power intensity, with dark-brilliant colors representing higher power and light-dull colors denoting lower power. The figure below illustrates an example of DSA during 30 minutes of a propofol anesthetic. At minutes 0-5, the majority of EEG power is concentrated in lower frequencies, denoted by the intense red color at frequencies < 3 Hz (lower left), while a minority of EEG power exists in higher frequencies, denoted by blue color at frequencies > 15 Hz. At minutes 8-27, there is an increase in power at frequencies 10-12 Hz [alpha frequency] as indicated by the appearance of yellow/orange colors, along with a decrease in power at frequencies < 5 Hz as indicated by the change from red to yellow. The DSA shows that the level of hypnosis was greater at minutes 0-5 than at 8-27, as indicated by the majority of power existing in lower frequencies in minutes 0-5. Because propofol and sevoflurane exert dose-dependent effects on frequency and power, the DSA can visually display hypnotic level during the course of the anesthetic.”1
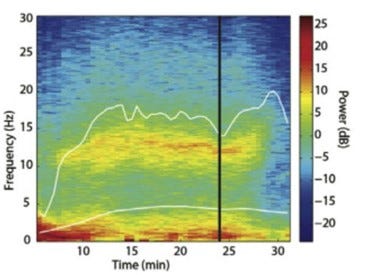
In today’s PAAD, Yuan et al. used spectral edge frequency 95 (SEF95), the frequency that the majority (95%) of EEG power lies under (denoted in the figure above by the higher white line), to determine the depth of anesthesia in infants and children 3-12 months of age. “In general, with increased sevoflurane or propofol dose, EEG amplitude/power tends to increase whereas frequency decreases, resulting in larger EEG amplitude occurring at a lower frequency range and a decrease in SEF95. In adults and older children, SEF95 ranges of 15 to 20 Hz, 10 to 15 Hz, and less than 10 Hz represent targets for sedation, surgical maintenance, and intubation, respectively, and correspond to propofol effect site concentration of 2 to 3 μg/ml, effect site concentration 3 to 4 μg/ml, and effect site concentration 4 to 6 μg/ml. The primary objective of this study was to determine the SEF95 values corresponding to three clinical endpoints of anesthesia depth during propofol anesthesia in infants 3 to 12 months old. The three endpoints are responses to stimulation with an oral pacifier (consciousness), noxious electrical stimulation (pain), and laryngoscopy (intubation). Dixon’s up–down method was used to determine the SEF95 where 50% of infants (ED50) did not respond to each of the three stimuli. The secondary objectives were to determine the SEF95 where 90% of infants did not respond to the stimulus (ED90) and the relationship between SEF95 and propofol plasma concentration.”1
The good news? It worked and the values obtained are reproducible! “Of 49 enrolled infants, 44 evaluable (90%) showed distinct SEF95 for endpoints: pacifier (ED50, 21.4 Hz; ED90, 19.3 Hz), electrical stimulation (ED50, 12.6 Hz; ED90, 10.4 Hz), and laryngoscopy (ED50, 8.5 Hz; ED90, 5.2 Hz). From propofol 0.5 to 6 μg/ml, a 1-Hz SEF95 increase was linearly correlated to a 0.24 (95% CI, 0.19 to 0.29; P < 0.001) μg/ml decrease in plasma propofol concentration (marginal R 2 = 0.55).”1
From our perspective, this is game changing and for really the first time, we don’t have to fly blind. We have a biomarker, SEF95, which can be used to titrate individual propofol dosing in infants, children and adolescents. WOW!
Send your thoughts and comments to Myron who will post in a Friday reader response.
References
1. Yuan I, Garcia-Marcinkiewicz AG, Zhang B, et al. Electroencephalographic Indices for Clinical Endpoints during Propofol Anesthesia in Infants: An Early-phase Propofol Biomarker-finding Study. Anesthesiology 2024;141(2):353-364. (In eng). DOI: 10.1097/aln.0000000000005043.
2. Yuan I, Missett RM, Jones-Oguh S, et al. Implementation of an electroencephalogram-guided propofol anesthesia education program in an academic pediatric anesthesia practice. Paediatric anaesthesia 2022 (In eng). DOI: 10.1111/pan.14520.
3. Yuan I, Xu T, Skowno J, et al. Isoelectric Electroencephalography in Infants and Toddlers during Anesthesia for Surgery: An International Observational Study. Anesthesiology 2022;137(2):187-200. (In eng). DOI: 10.1097/aln.0000000000004262.
4. Yuan I, Xu T, Kurth CD. Using Electroencephalography (EEG) to Guide Propofol and Sevoflurane Dosing in Pediatric Anesthesia. Anesthesiology clinics 2020;38(3):709-725. (In eng). DOI: 10.1016/j.anclin.2020.06.007.
5. Chao JY, Legatt AD, Yozawitz EG, Adams DC, Delphin ES, Shinnar S. Electroencephalographic Findings and Clinical Behavior During Induction of Anesthesia With Sevoflurane in Human Infants: A Prospective Observational Study. Anesthesia and analgesia 2020;130(6):e161-e164. (In eng). DOI: 10.1213/ane.0000000000004380.
6. Purdon PL, Sampson A, Pavone KJ, Brown EN. Clinical Electroencephalography for Anesthesiologists: Part I: Background and Basic Signatures. Anesthesiology 2015;123(4):937-60. (In eng). DOI: 10.1097/aln.0000000000000841.